Data that thinks.

TRUSTED BY DATA TEAMS AT
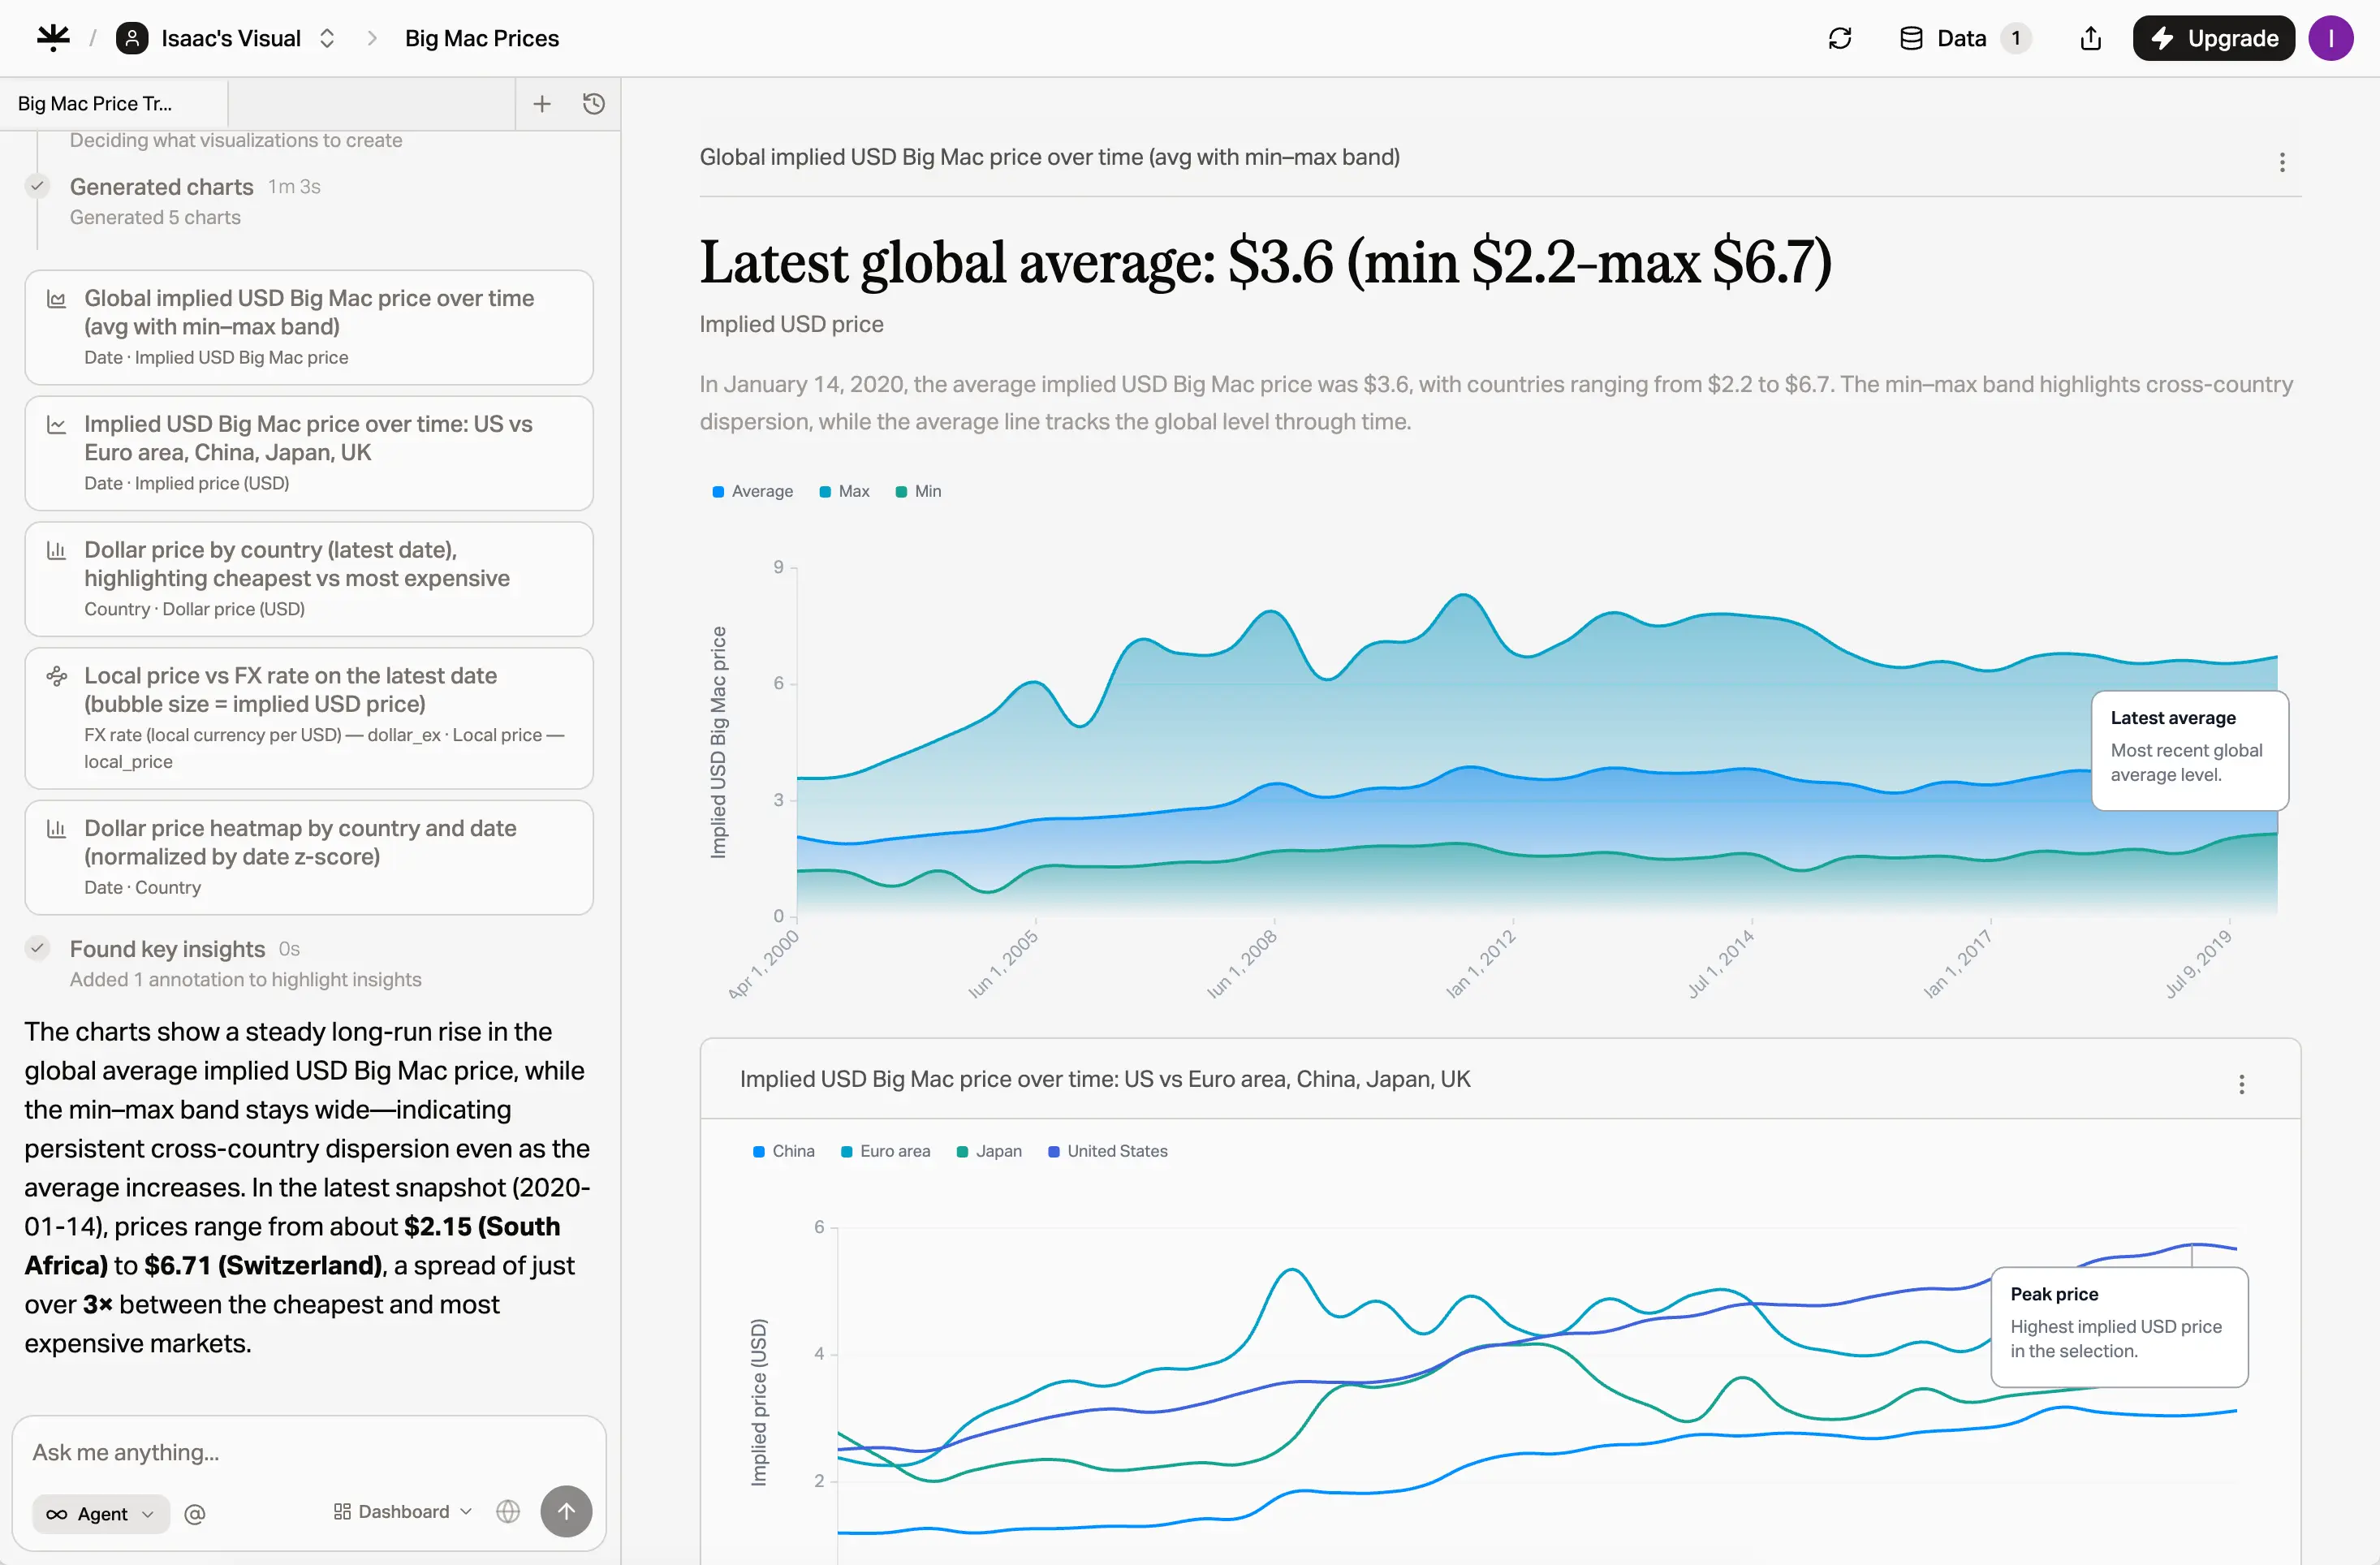
Ask for charts, get answers.
Skip the query builder. Just describe your data needs in plain English, and Visual constructs the SQL, processes the data, and renders the perfect chart.
159 fish across 7 species; most common is Perch (56)
The bar chart ranks species by number of recorded fish...
Connect anything.
PostgreSQL, Snowflake, BigQuery, or a simple CSV. Visual unifies your data sources in one intelligent interface.
Built for teams.
Share insights instantly. Comment on data points, create shared dashboards, and export to presentation decks.
This outlier looks interesting. Can we drill down?
Great insight! I'll add this to the Q4 deck.
Loved by data teams.
"Visual transformed how our data team presents insights. What used to take hours of wrangling in spreadsheets now happens in minutes."
Sarah Chen
Head of Data, Ramp
"The AI understands context in a way that other tools don't. It just gets what I'm trying to visualize without endless prompting."
Marcus Rivera
Analytics Lead, Linear
"We've cut our reporting time by 80%. Our stakeholders now get real-time dashboards instead of weekly PDFs."
Emily Watson
VP Engineering, Notion
"Finally, a tool that lets non-technical team members explore data without needing SQL knowledge. It's a game changer."
David Park
Product Manager, Figma
"The quality of the visualizations is outstanding. They look like they were designed by a human, not generated by a machine."
Jessica Li
Data Scientist, Stripe
"Visual has become the default way we share data at our company. It's faster, cleaner, and simply better than the alternatives."
Tom Baker
CTO, Vercel
Simple pricing for everyone.
Start for free, upgrade when you need to. No hidden fees or surprise charges.
Free
For personal projects
- 5 visualizations / mo
- CSV uploads (10MB)
- Basic chart types
- Community support
Pro
For professional teams
- Unlimited visualizations
- Connect any database
- Advanced chart types
- Priority support
- Export to PDF/PNG
Enterprise
For large organizations
- Everything in Pro
- SSO/SAML
- Dedicated support
- Custom integrations
- SLA guarantees
Data with Intelligence.
Join data teams using Visual to turn complex data into beautiful, actionable insights with AI.